NNNS Chemistry blog
Prevous: New descriptor for molecular stability
Next: Gold nanorod mass-production
Endo or exo? Balancing bulkyness
28 February 2011 - OrgChem
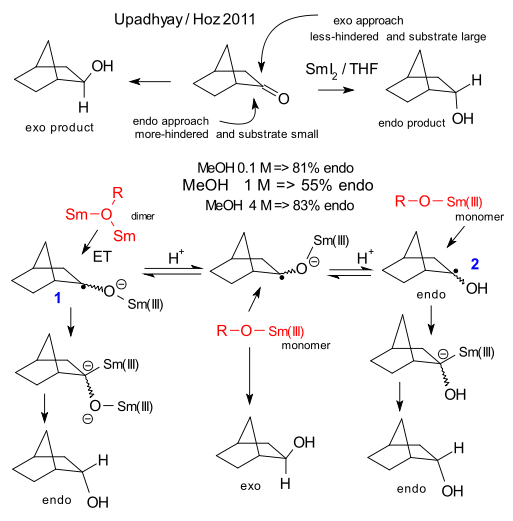
 Combine the ketone norcamphor, the reducing agent samarium iodide, the proton donor methanol and the solvent THF in a test tube and the scientific paper will write itself. Because how do you make sure only the endo or exo alcohol is formed in this organic reduction?. In general, the exo product is formed by unhindered endo-attack from a relative large substrates. For smaller substrates the more hindered exo attack is also an option. In a recent paper Upadhyay & Hoz establish that proton donors such as ethanol, trifluoroethanol (TFE) and ethylene glycol (EG) stick to the plot because increasing the concentration of the alcohol increases the concentration of the relatively large SmI2.ROH adduct as substrate and hence the endo/exo ratio. Methanol and water on the other hand appear to be behaving oddly because on increasing their concentration the endo concentration first decreases before it increases.
So what sets these two groups of proton donors apart? According to Upadhyay & Hoz it is not polarity or acidity but their ability to form a complex with samarium ions. The reaction product of the first electron transfer is a radical anion (1) with a bulky -O-Sm(III) substituent. At low concentrations, water and methanol can join up with two Sm ions forming an even bulkier Sm-O(R)-Sm dimer. The dominant orientation for the substituent group after the second electron transfer and final protonation is therefore endo. When the proton donor concentration increases less dimer is present. When the substituent and electron donor are about equal size endo and exo product are expect in equal amounts. With even higher proton donor concentration protonaton takes place before the second electron transfer forming intermediate 2. Now the electron donor is again much larger the the oxo substituent and endo-formation prevails again. Convincing theory? Not all the data collected in the paper are helpful. Comparing the high-methanol reaction with the low methanol reaction is chemical yield is cut in half at a tenth of the reaction time which is odd. The TFE and EG plots do not rule out an actual U shape, it would be a matter of longer measurements at lower concentrations.
